Arztzahlenentwicklung, Altersstruktur, Haupttätigkeit
Ärztestatistik
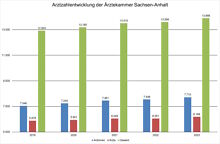
Arztzahlenentwicklung der Ärztekammer Sachsen-Anhalt
Stand: 31.12.2023
| Jahr | Ärztinnen | Ärzte | Gesamt |
| 2023 | 7.710 | 6.188 | 13.898 |
| 2022 | 7.548 | 6.051 | 13.599 |
| 2021 | 7.461 | 6.049 | 13.510 |
| 2020 | 7.244 | 5.941 | 13.185 |
| 2019 | 7.046 | 5.878 | 12.924 |
| 2018 | 6.934 | 5.842 | 12.776 |
| 2017 | 6.833 | 5.741 | 12.574 |
| 2016 | 6.745 | 5.612 | 12.357 |
| 2015 | 6.570 | 5.530 | 12.100 |
| 2014 | 6.488 | 5.476 | 11.964 |
| 2013 | 6.328 | 5.434 | 11.762 |
| 2012 | 6.134 | 5.313 | 11.447 |
| 2011 | 6.002 | 5.239 | 11.241 |
| 2010 | 5.787 | 5.153 | 10.940 |
| 2009 | 5.631 | 5.107 | 10.738 |
| 2008 | 5.510 | 5.060 | 10.570 |
| 2007 | 5.462 | 5.008 | 10.470 |
| 2006 | 5.317 | 4.949 | 10.266 |
| 2004 | 5.126 | 4.881 | 10.007 |
| 2005 | 5.221 | 4.926 | 10.147 |
| 2003 | 4.972 | 4.722 | 9.694 |
| 2002 | 4.862 | 4.653 | 9.515 |
| 2001 | 4.864 | 4.604 | 9.468 |
| 2000 | 4.827 | 4.596 | 9.423 |
| 1999 | 4.756 | 4.559 | 9.315 |
| 1998 | 4.665 | 4.453 | 9.118 |
| 1997 | 4.565 | 4.351 | 8.916 |
| 1996 | 4.495 | 4.296 | 8.791 |
| 1995 | 4.354 | 4.118 | 8.472 |
| 1994 | 4.263 | 3.932 | 8.195 |
| 1993 | 4.135 | 3.720 | 7.855 |
| 1992 | 3.915 | 3.520 | 7.435 |
| 1991 | 3.794 | 3.400 | 7.194 |
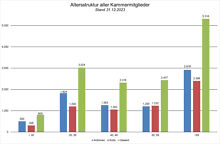
Altersstruktur aller Kammermitglieder
Stand: 31.12.2023
| Alter | Ärztinnen | Ärzte | Gesamt |
| < 30 | 500 | 305 | 805 |
| 30..39 | 1.824 | 1.200 | 3.024 |
| 40..49 | 1.263 | 1.053 | 2.316 |
| 50..59 | 1.205 | 1.232 | 2.437 |
| > 59 | 2.918 | 2.398 | 5.316 |
| Gesamt | 7.710 | 6.188 | 13.898 |
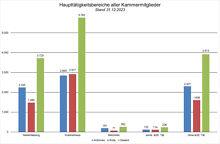
Haupttätigkeitsbereiche aller Kammermitglieder
Stand: 31.12.2023
| Tätigkeitsbereiche | Ärztinnen | Ärzte | Gesamt |
| Ambulant / Niederlassung | 2.245 | 1.480 | 3.725 |
| Krankenhaus | 2.845 | 2.917 | 5.762 |
| Behörden | 191 | 71 | 262 |
| Sonstige ärztliche Tätigkeit | 122 | 114 | 236 |
| ohne ärztliche Tätigkeit | 2.307 | 1.606 | 3.913 |
| Gesamt | 7.710 | 6.188 | 13.898 |
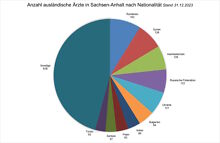
Anzahl ausländischer Ärzte in Sachsen-Anhalt nach Nationalität
Stand: 31.12.2023
| Nationalität | Anzahl | Anteil in Prozent |
| Rumänien | 163 | 8,89 |
| Syrien | 138 | 7,53 |
| Aserbaidschan | 126 | 6,87 |
| Russische Föderation | 122 | 6,66 |
| Ukraine | 121 | 6,60 |
| Bulgarien | 84 | 4,58 |
| Indien | 66 | 3,60 |
| Polen | 63 | 3,44 |
| Serbien | 57 | 3,11 |
| Türkei | 55 | 3,00 |
| Sonstige | 838 | 45,72 |
| Gesamt | 1.833 |